2011年も残りあと僅か。毎年行なっているblogを通しての1年の総括を数回に分けて行なってみたいと思います。
The first one is blog statistics data edition
※分析期間:2010年12月30日から2011年12月29日
Access Analysis Summary
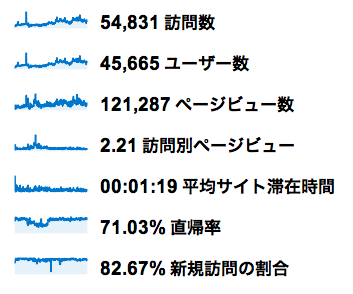
This is the result of analysis by Google Analytics. This is the first time I’ve published these results on my blog. I’m not a celebrity, and this is my private blog, so I guess it’s just like this.
I think the number of accesses went up because of the Tokyo Marathon and grain orchestra.
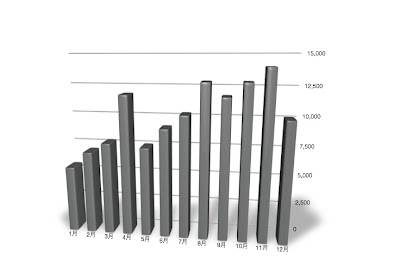
Number of page views per month
|
month |
number of page views |
|---|---|
|
January |
5,657 |
|
February |
Seven thousand thirty-six. |
|
March |
7,852 |
|
April |
11,845 |
|
May |
7,597 |
|
June |
9,210 |
|
July |
10,339. |
|
August |
12,895 |
|
September |
11,783 |
|
October |
12,896 |
|
November |
14,030 |
|
December |
10,147. |
|
total amount |
121,287 |
The number of page views has been growing since April. Finally, we have exceeded 10,000 page views per month.
It is especially noticeable after July. Probably there is an influence of grain orchestra. Also, I think the “Most Beautiful Villages of France” series had a great impact on the volume.
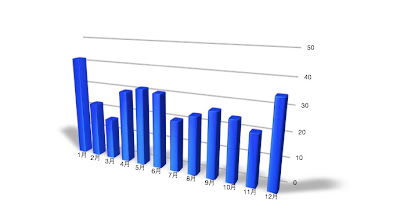
Number of articles posted Number of monthly archives
|
month |
Number of archives by month |
|---|---|
|
January |
42 |
|
February |
23 |
|
March |
17 |
|
April |
30 |
|
May |
32 |
|
June |
31 |
|
July |
21 |
|
August |
24 |
|
September |
27 |
|
October |
25 |
|
November |
21 |
|
December |
35 |
It fluctuates a little, but the number of posts is about 20 to 30. That means I’ve been updating almost every day.
Most of them are travelogues. It has become quite formulaic, but on the other hand, there are still many issues to be solved as it is becoming a rut.
以上、blog統計データを簡単にサマリーさせていただきました。次回はもう少し「コンテンツ」に着目した総括を行なってみたいと思います。