I’ve been wanting to write about access analysis for a while now. Needless to say, this blog is just my personal diary goofing around.
Therefore, because I do not make a living at this, I feel that access analysis is not very meaningful, but I actually think that I can learn a lot about the trend of the net industry and the flow of business as a whole.
So I’ve finally gotten off my ass and started this series, which I’ll be writing about in the next few posts.
Google Analytics is used, and analysis data is obtained from the iPhone app.
Before I start writing, I’d like to briefly introduce the tools I use.
使っているのは、「Google Analytics」、これはアクセス解析では定番といえるものでしょう。
そしてその分析データやレポートを見るのに利用しているのが、以前当ブログでもご紹介した「Analytics Pro」です。(ご参考:iPhone App: Analytics Proがとっても使いやすい)
The interface is very easy to read, and the report output function is excellent.
I find it more convenient than using it on my PC.
“What we can learn from the analysis of “OS and Browser
Now, let’s get to the point. In this first article, I’ll write about what I can find out from the analysis of “OS and Browser”. The analysis of “OS and Browser” is the statistics of OS and browser used by people who access this blog.
Let me conclude by saying.
直近においては「WIndowsからMacへの流れ」というものが高々月10,000いくかどうかのページビューである当blogからでも垣間見ることができた
That’s what I mean.
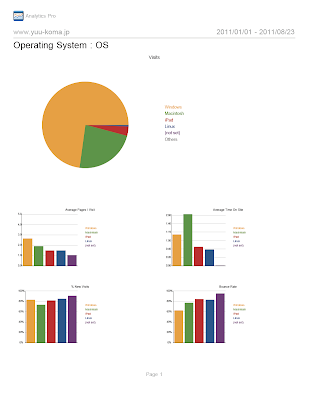
First, let’s take a look at the OS analysis. The distribution of the number of accesses by OS from January this year to today is as follows.
As you can see, almost three quarters of the accesses are from Windows. (72,8% of the total, to be exact)
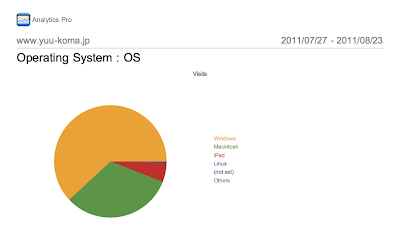
However, when the same analysis is performed for the last month, the result is as follows.
Access from WIndows has dropped to about 60% (61.8% to be exact). You can also see from this graph that the number of accesses from Mac is increasing, and you can also see the increase in accesses from iPad.
Next, let’s look at Browser’s access analysis, and as with OS, first let’s look at the distribution of accesses since the beginning of this year.
We can see that just under 50% of the traffic is coming from Internet Explorer. It’s also worth noting that Chrome is second at this point.
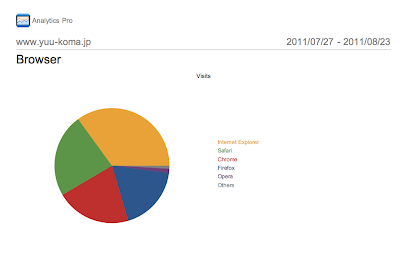
This is what it looks like in the last month.
You can see that Internet Explorer has decreased to the 30% level, and Safari has overtaken Chrome to become the browser with the second largest number of accesses.
Because the share of IE falls and the share of Safari rises, and Safari is Browser which Apple develops as you know, it can be confirmed that migration to Mac is progressing even from this Browser analysis.
From the above analysis of access from OS and Browser, it is thought that the number of users who have migrated from Windows to Mac has increased, although it is an analysis in the narrow target of the number of access analysis of this blog.
Can we really conclude that the number of Mac users is increasing?
By the way, can we really conclude that the number of Mac users has increased with all this analysis?
The answer is no, we do not believe this is enough information.
Because, for example, many of my acquaintances and repeat readers who have been reading this blog for a long time may have just moved to Mac by accident…
しかし、それでもなお僕はMacユーザーからのアクセス数が増えている=Macユーザーが増えていると考えています。
Of course, there’s a good reason for that.
その理由を理解するには、Google Analyticsにおいてまた違ったデータを分析する必要がありますが、こちらについてはまた次回以降にお話ししたいと思います。(続く)


